|
Plots Window |
Plots Window

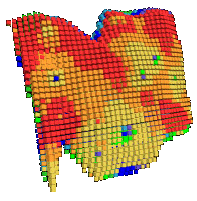
Studio NPVS employs “Plot Views” (also known as “Section Views”) for the visualization of block models, surfaces and outlines. Plot Views display 3D Objects; Studio NPVS converts all data structures to a 3D Object format for visualization and export.
In Studio NPVS and related products, the primary method of visualization is a 3D window. It is the primary 3D window that is updated when the options on the Visualize control panel are used, for example, when visualizing LG Phases.
Plot views, however, can be used to present your strategic planning information in a format suitable for hard copy. In legacy products, such as NPV Scheduler, the Plots workspace was the primary viewport for model and surface data.
You can create plot views for any data based in a 3D window using the create-plot-view command (quick key 'cpv') or by the collection of tools available on the Manage ribbon that appears once the Plots workspace is displayed.
One or more plot sheets can contain one or more plot items. Plot items can represent 3D data views, legends, tables, a north arrow, a data table or any one of a wide range of things to enhance your plot.
More about the Plots workspace...
Functions
-
Plot block models with color coded legends in plan or vertical sections. Query cells for attribute values.
-
Hosts one or more projections representing a view (independently formatted) of 3D data. These projections can be tailored with regards to formatting and overlay content.
-
Host supporting plot items such as charts, tables and other enhancements to maximize the impact of your report.
-
Plot-specific annotations and strings representing geological structures can be added.
-
All plot formatting can be stored in a template for consistent reporting standards.
|
|
Related Topics |
|
|
Introducing
the Plots Window
|
Copyright © Datamine Corporate Limited
JMN 20065_01_EN

